
The oral microbiome is second to the gut microbiome in human microbiome complexity partly due to its constant exposure to inhaled and ingested microbes. There are estimated to be more than 700 microbial species in the oral cavity and 54% of these microbes are uncultivable. As such, elucidating the metabolic functions of the uncultivable oral microbiome is challenging. This is further complicated by the division of the oral microbiome into diverse microhabitats by tissue. Each microhabitat has its own environmental condition and harbors a unique set of microbes that have different adaptations as a consequence. Adaptation to different microhabitats requires different sets of functional genes. Identifying these genes within healthy tissues is important to understand their roles in medical conditions such as osteitis, cardiovascular disease, icrus, pre-term labor, diabetes, and more. Detection of changes in these genes and their encoded pathways may lead to the identification of key pathways that may serve as predictive or therapeutic biomarkers for different diseases. However, past studies of the healthy oral microbiome have been limited in that they either rely on culture-dependent methods or 16S rRNA gene sequencing. The former method allows assessment only of culturable species, and the latter focuses on a single gene for taxa identification and does not allow identification of functional genes. To fill the gap in the literature, Caselli et al. (2020) used shotgun sequencing to profile samples of diverse oral tissues from healthy individuals and described their microbiome and resistome. Although they did not evaluate the functional metagenome of the healthy oral samples, they made this dataset publicly available, providing an important reference set for later oral functional metagenome studies. Using the oral microbiome shotgun sequencing data of 12 healthy individuals from Caselli et al. (2020), we performed an oral functional metagenomic analysis assessing gene ontology terms.
We imported the publicly available Caselli dataset from NCBI’s Sequence Read Archive using the CosmosID-HUB SRA import tool. Then we ran a functional workflow on the samples using the Gene Ontology (GO) database. Finally, we performed a comparative analysis using the oral tissues sampled as our comparison cohorts. To inspect the functional metagenomes of different oral tissues, we plotted a relative abundance heatmap of microbial GO terms clustered by sample similarity in composition (Fig. 1). Clustering of samples on the heatmap illustrated that while subgingival plaque and oral mucosa samples were similar to each other in GO term composition, tongue, hard palate, supragingival plaque, and keratinized gingiva samples had closer GO term composition. Interestingly, oral rinse and saliva samples did not illustrate apparent clustering and dispersed across the samples, possibly due to dependency on sampling location. After having clear divergences in GO terms compositions of tissues, we decided to investigate if differences in GO term relative abundances translated into alpha and beta diversity variations.
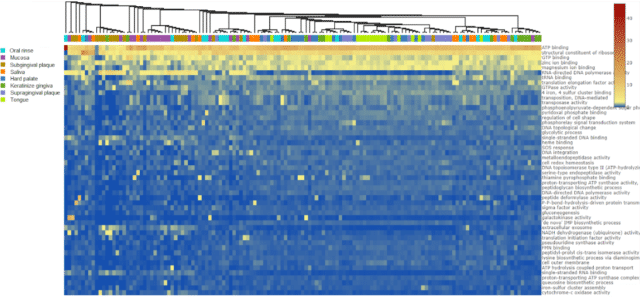
Figure 1: A heatmap illustrating functional gene relative abundances of the top 50 most abundant gene ontology (GO) terms. Samples are clustered by the similarity of samples in GO term relative abundance.
To elucidate how alpha diversity of GO terms varies between oral tissues, first, we calculated the mean Simpson’s diversity index of each tissue, plotted the box plots of resulting mean index scores and performed a pairwise Wilcoxon rank sum Test over the index scores (Fig. 2). The results illustrated that subgingival plaque had significantly higher mean Simpson index compared to all other tissues tested, indicating that a higher dominant GO term richness than all other tissues. On the other hand, oral mucosa samples clustered with supragingival plaque samples on the heatmap had the most variable Simpson index score and it was only significantly less than the subgingival plaque’s. The rest of the tissues did not illustrate any significant difference in Simpson index between them, with the exception of hard palate samples being significantly less dominant functional gene-rich than supragingival plaque samples. The Simpson’s Index evaluates just the dominant functional term richness, and not the functional term evenness or rare, low abundance functional terms. To assess functional term evenness, we performed Shannon’s index calculation and compared tissues using the Wilcoxon test (Fig. 3). The outcome of the Shannon index comparison complemented the findings of Simpson’s comparison. The subgingival plaque, which had the significantly highest Simpson index, had the least Shannon’s index, followed by oral mucosa samples which again illustrated the largest variation. Altogether, the alpha diversity indices illustrated that the subgingival plaque and oral mucosa had the highest dominant species richness but had fewer rare species, and showed less species evenness.
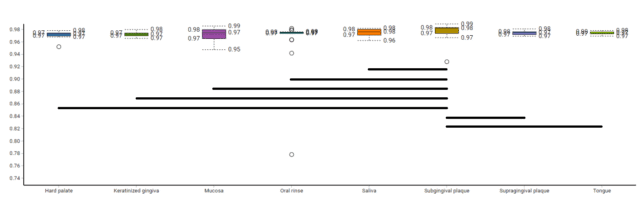
Figure 2: A box plot illustrating Simpson’s Diversity Index of oral tissue functional metagenomes, black lines indicate significantly different pairs in Simpson’s Alpha Diversity Index.
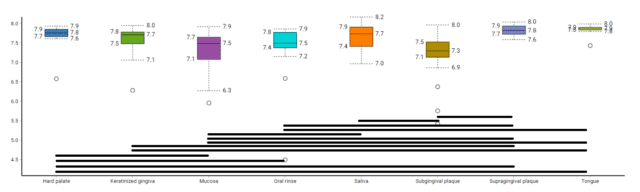
Figure 3: A box plot illustrating Shannon’s Diversity Index of oral tissue functional metagenomes, black lines indicate significantly different pairs in Shannon’s Alpha Diversity Index.
We next performed a beta diversity analysis to see if functional gene compositions of tissues were significantly different from one another. To do that, we performed principal coordinate analyses (PCOA) on the Bray-Curtis dissimilarity matrices of the tissue cohorts regarding functional gene presence/absence, as well as relative abundance. Then, we plotted the 3D visualization of the PCOA results (Fig. 4). The plot illustrated that subgingival plaque, oral mucosa samples and supragingival plaque, hard palate, tongue, and keratinized gingiva samples cluster separately from one another, but also oral rinse and saliva samples create a third cluster in the middle. This may be due to contamination in these oral samples from first sampling all the other tissues. Nonetheless, a PERMANOVA test illustrated that each tissue cohort was significantly dissimilar to each other tissue cohort, highlighting that microenvironments of oral tissues led to the divergence of their habitant microbial communities in functional metagenomics. Consequently, further studies that compare oral microbiome functional metagenomics in healthy vs disease cohorts should take into account differences at a tissue level, as comparing different oral tissues may cause spurious, unreproducible results.
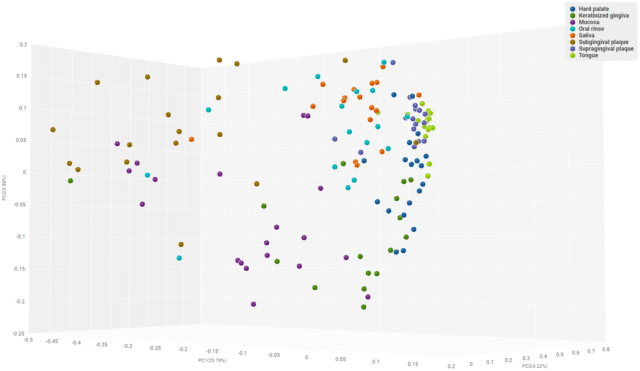
Figure 4: A 3D visualization of Principal Coordinates Analyses of Bray-Curtis Dissimilarity Matrix of oral functional metagenomes by oral tissues
